plot_equilibrium
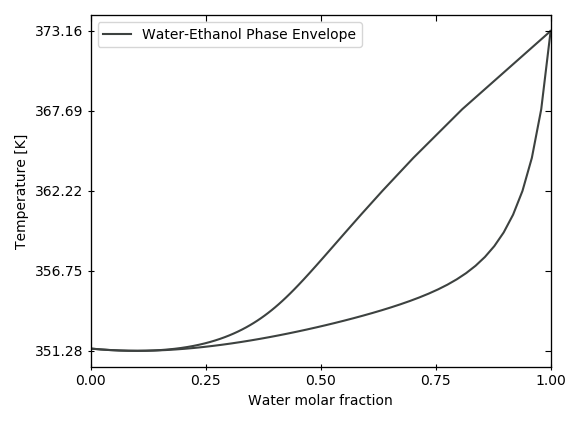
- thermosteam.equilibrium.plot_equilibrium.plot_vle_binary_phase_envelope(chemicals, T=None, P=None, color=None, thermo=None)[source]
Plot the binary phase envelope of two chemicals at a given temperature or pressure.
- Parameters
Examples
>>> # from thermosteam import equilibrium as eq
>>> # eq.plot_vle_binary_phase_envelope(['Ethanol', 'Water'], P=101325)
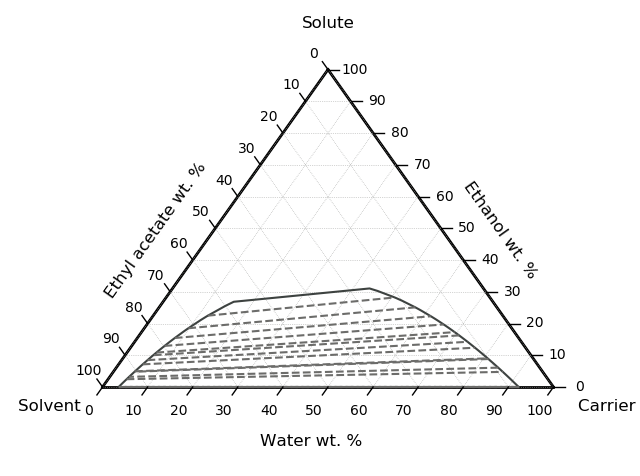
- thermosteam.equilibrium.plot_equilibrium.plot_lle_ternary_diagram(carrier, solvent, solute, T, P=101325, thermo=None, color=None, tie_line_points=None, tie_color=None, N_tie_lines=15, N_equilibrium_grids=15)[source]
Plot the ternary phase diagram of chemicals in liquid-liquid equilibrium.
- Parameters
carrier (Chemical) –
solvent (Chemical) –
solute (Chemical) –
T (float, optional) – Temperature [K].
P (float, optional) – Pressure [Pa]. Defaults to 101325.
thermo (Thermo, optional) – Thermodynamic property package.
color (str, optional) – Color of equilibrium line.
tie_line_points (1d array(size=3), optional) – Additional composition points to create tie lines.
tie_color (str, optional) – Color of tie lines.
N_tie_lines (int, optional) – Number of tie lines. The default is 15.
N_equilibrium_grids (int, optional) – Number of solute composition points to plot. The default is 15.
Examples
>>> # from thermosteam import equilibrium as eq
>>> # eq.plot_lle_ternary_diagram('Water', 'Ethanol', 'EthylAcetate', T=298.15)